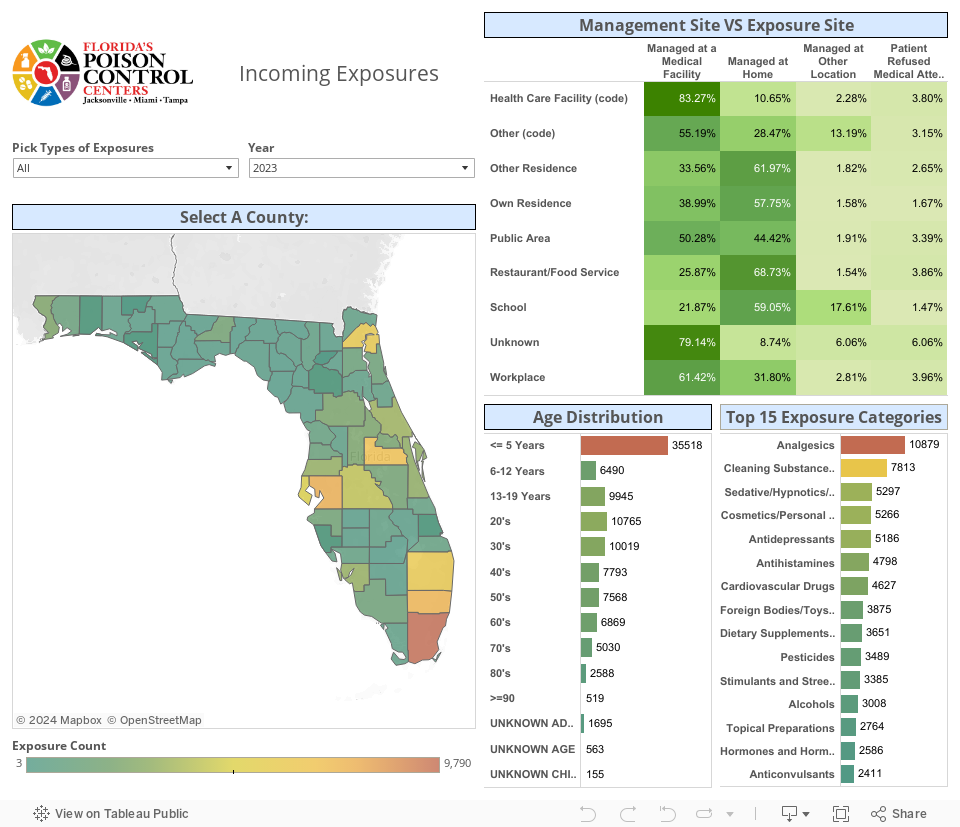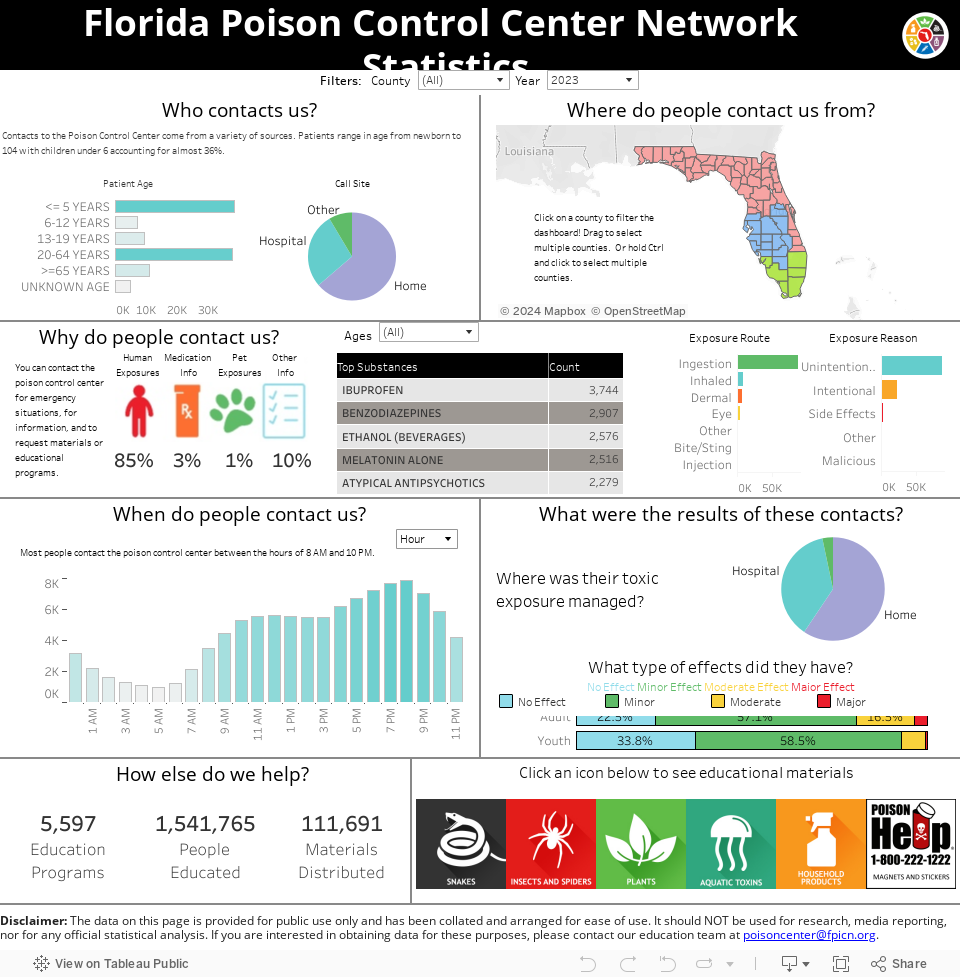
These poison exposures can be analyzed further using the Interactive Data Dashboard below:
Total Numbers for Each Year
- 2016: The Centers in Florida handled 146,664 incoming calls. Of these, 108,498 were reported as known or possible exposures to potentially toxic substances (drugs, chemicals, bite/stings, food poisonings, etc.). In addition, the Centers also received 38,095 calls requesting poison information and placed 162,505 follow-up calls back to patients to check on their status.
- 2017: The Centers in Florida handled 135,914 incoming calls. Of these, 108,428 were reported as known or possible exposures to potentially toxic substances (drugs, chemicals, bite/stings, food poisonings, etc.). In addition, the Centers also received 29,934 calls requesting poison information and placed 155,297 follow-up calls back to patients to check on their status.
- 2018: The Centers in Florida handled 135,336 incoming calls. Of these, 110,246 were reported as known or possible exposures to potentially toxic substances (drugs, chemicals, bite/stings, food poisonings, etc.). In addition, the Centers also received 25,000 calls requesting poison information and placed 139,808 follow-up calls back to patients to check on their status.
- 2019: The Centers in Florida handled 139,231 incoming calls. Of these, 117,355 were reported as known or possible exposures to potentially toxic substances (drugs, chemicals, bite/stings, food poisonings, etc.). In addition, the Centers also received 21,867 calls requesting poison information and placed 141,538 follow-up calls back to patients to check on their status.
- 2020: The Centers in Florida handled a total volume of 224,592 incoming calls. Of these, 117,409 were traditional poisoning calls reported as known or possible exposures to potentially toxic substances (drugs, chemicals, bite/stings, food poisonings, etc.). In addition, the Centers also received 18,705 calls requesting poison information and placed 139,828 follow-up calls back to patients to check on their status. Finally, 88,315 of the total volume were calls specifically from the Florida Department of Health’s COVID-19 hotline (1-866-779-6121).
- 2021: The Centers in Florida handled a total volume of 192,496 incoming calls. Of these, 115,507 were traditional poisoning calls reported as known or possible exposures to potentially toxic substances (drugs, chemicals, bite/stings, food poisonings, etc.). In addition, the Centers also received 17,442 calls requesting poison information and placed 145,931 follow-up calls back to patients to check on their status. Finally, 59,334 of the total volume were calls specifically from the Florida Department of Health’s COVID-19 hotline (1-866-779-6121).
- 2022: The Centers in Florida handled 131,607 incoming calls. Of these, 113,037 were reported as known or possible exposures to potentially toxic substances (drugs, chemicals, bite/stings, food poisonings, etc.). In addition, the Centers also received 18,480 calls requesting poison information and placed 131,095 follow-up calls back to patients to check on their status.
Instructions for Interactive Data Dashboard Use
This data dashboard is interactive and allows the user to look at the Florida’s Poison Control Centers’ data in different ways. You can use multiple selections together to refine your search.
div.poison-data-content
- Select the calendar year you wish to view.
Use the drop down box to select 2014, 2015, or 2016. - Click on a County in the map to see the data change on the entire dashboard for that county only.
Click on the county again to bring it back to normal data display - Click on an Exposure Site/Management Site box to see the data change on the entire dashboard for this type of data.
Click on the box again to bring back to normal data display - Click on an Age Range to see data change on the entire dashboard for that age group.
Click again on the range to bring it back to normal data display - Click on a Call Category to see the dashboard data change for that type of poisoning.
Click again on the category to bring it back to normal data display
You can use multiple selections together to refine the data